PROJECTs
Paralana
Clean Renewable Geothermal energy in Australia.
Drilled to 4,012m depth with a reservoir temperature of 190°C
Heat gradients as high as 80°C per km of depth in initial shallow areas
Perfect candidate for new EGS engineering and methods from the US
Potential for new drilling in 2025 to extend Paralana 2’s well depth
about
The Paralana Project is a well-developed geothermal project with significant drilled and proven heat and pressure. Enhanced Geothermal System (EGS) EGS engineering and methods were not as advanced as exists today and, as such, the Company can quickly reassess and establish the potential of Paralana as a modern EGS project.
history
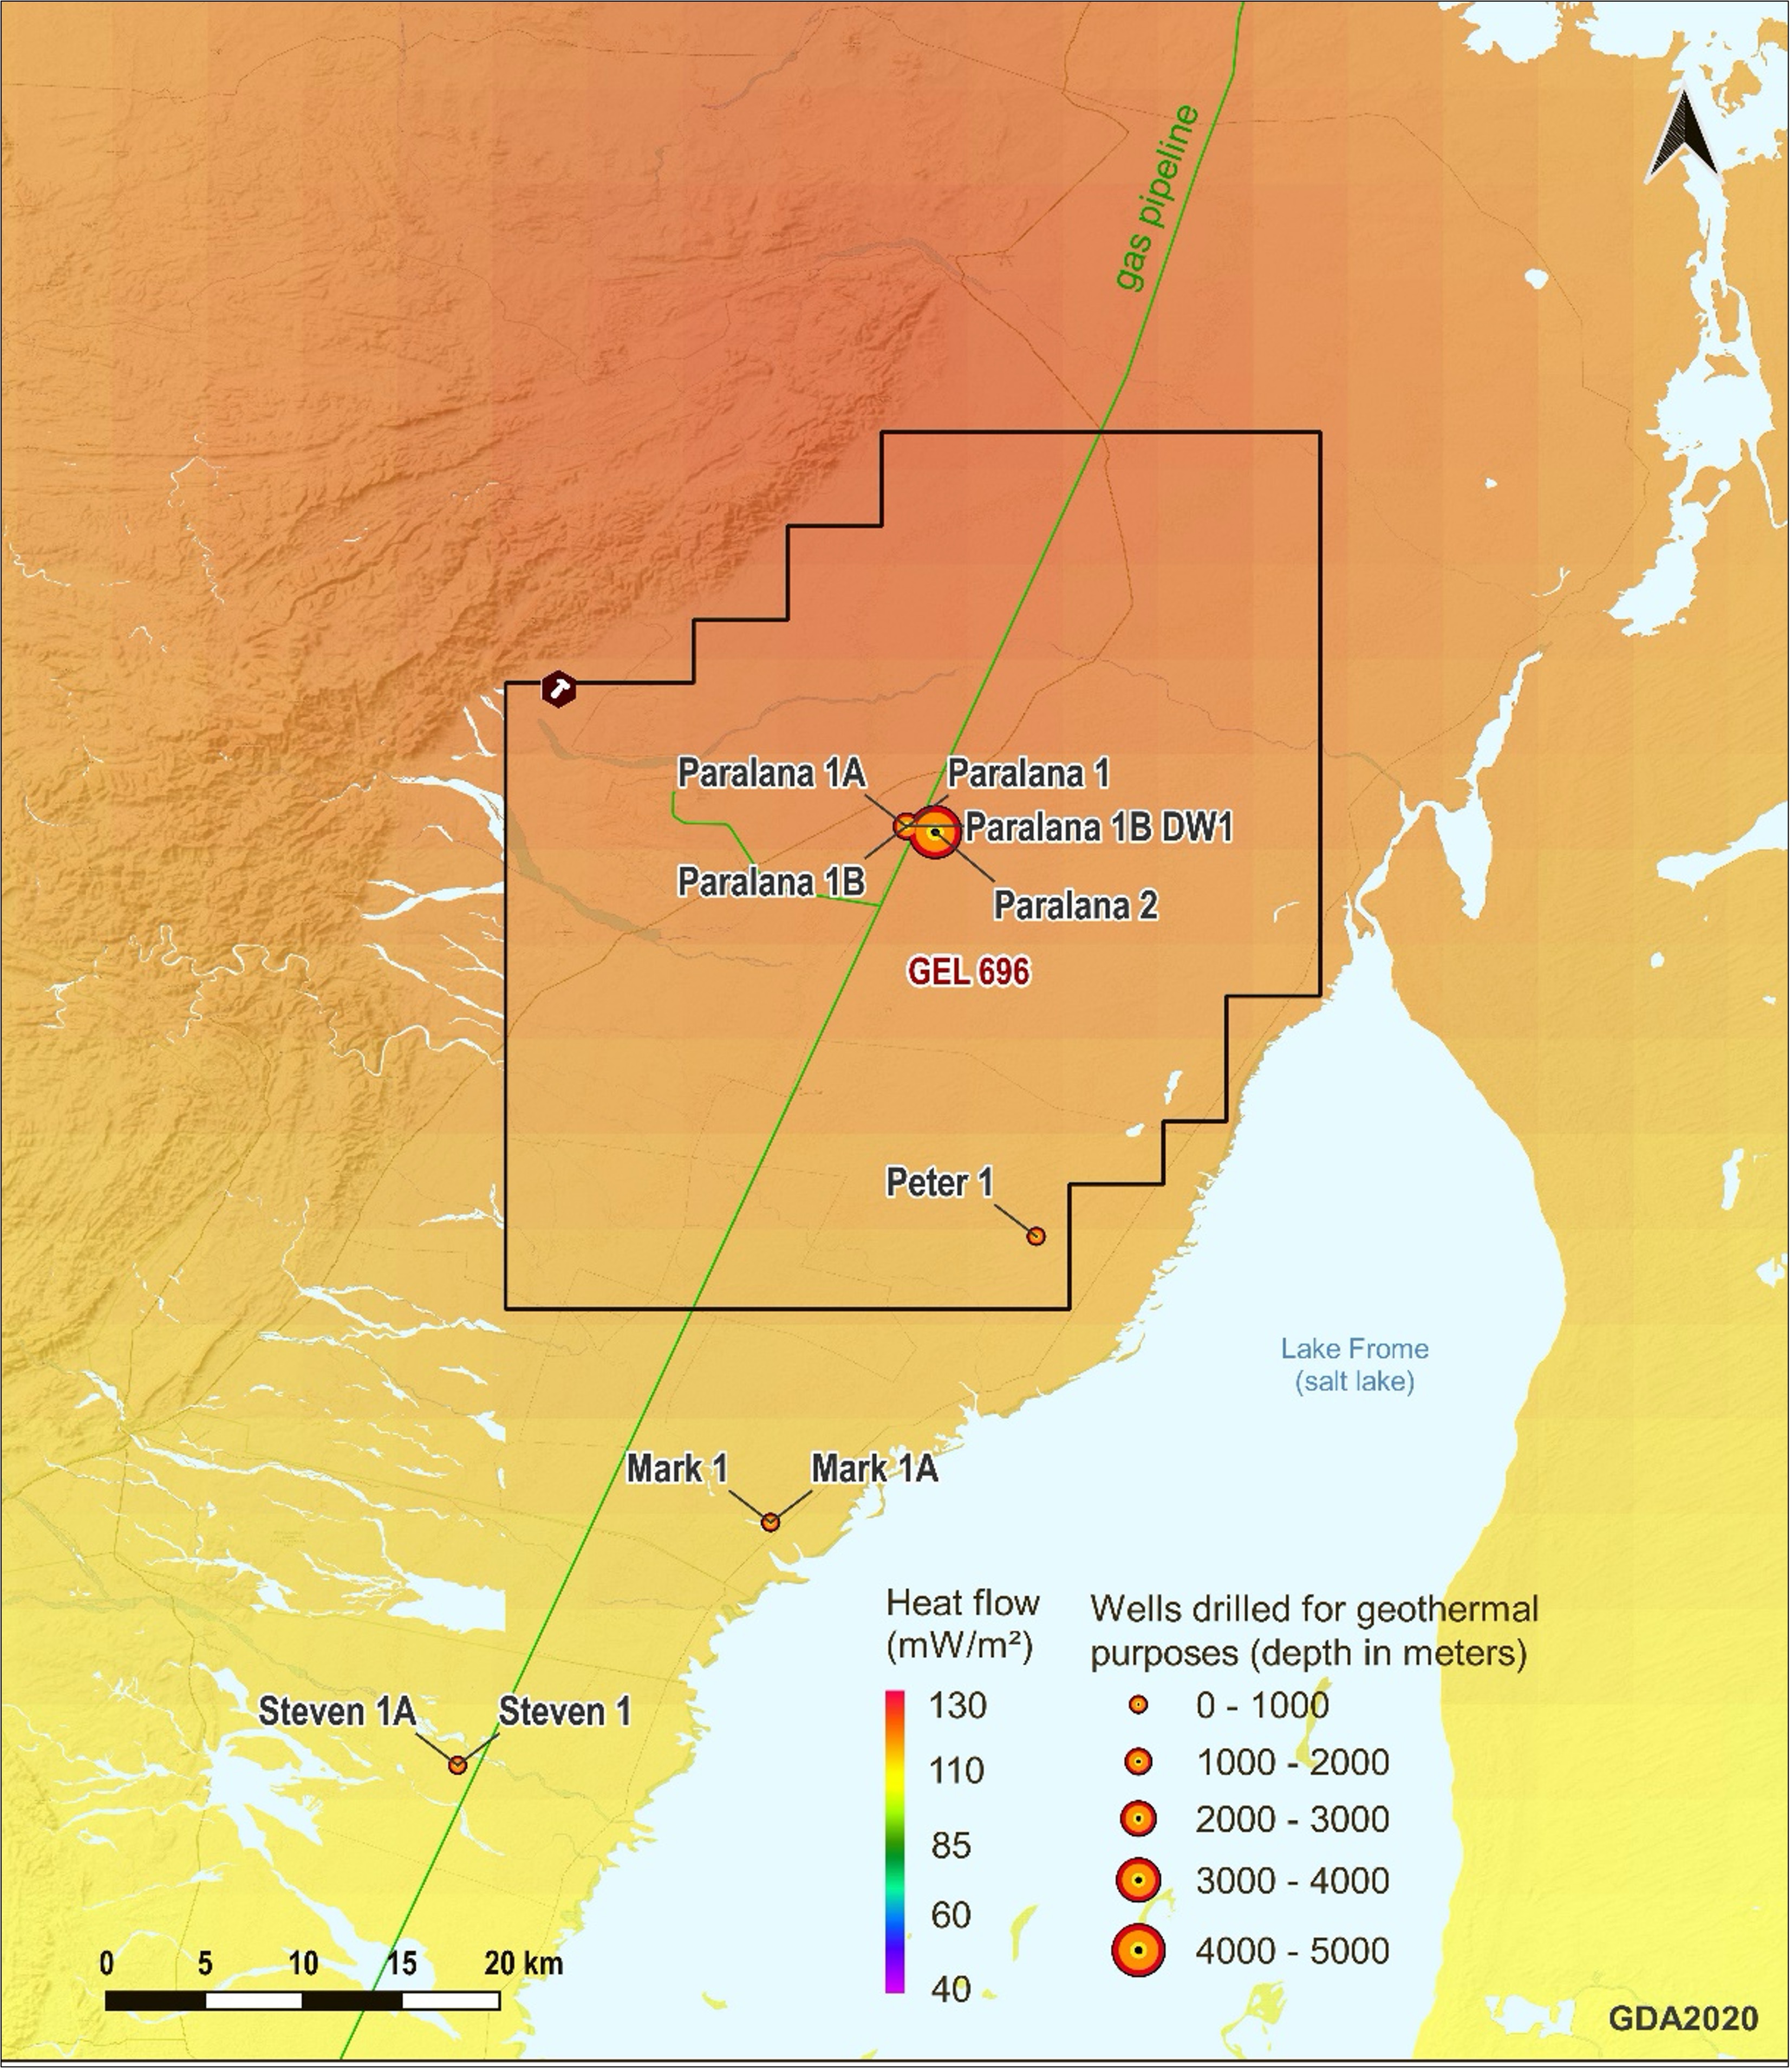
The Paralana project contained Australia’s second EGS project to be drilled to reservoir depth. The area was originally targeted from the known high heat production of the Mount Painter Inlier, the Paralana Hot Spring with 62°C water at the surface and the presence of insulating sediments. The Paralana 1B shallow heat flow well was drilled in September 2005 to a depth of 492m. The measured temperature gradient was over 80°C per km. The well was then deepened to 1,807m in June 2006, recording a bottom hole temperature of 109°C, and a calculated heat flow of 129 mW/m2.
The Paralana 2 well was spudded in late June 2009 and the rig was released in December 2009 after reaching a total depth of 4,012m. Highly fractured ground in the lower part of the well resulted in a partial well collapse, with 7-inch casing cemented in the well to a depth of 3,725m and could not be developed further. A temperature of 176°C was measured at a depth of 3,672m. Overpressures of approximately 3,300 psi in geothermal brines were found at depths between 3,670m and 3,864m.
In January 2011, the well was perforated over the interval 3,679m to 3,685m and a diagnostic fracture injectivity test was run. After stimulation, the measured well head pressure was 3,940 psi indicating that the injectivity test had successfully connected with over-pressured reservoir fluids. A larger stimulation was conducted in July 2011. 3.1 ML of fluid was injected over a five-day period. Initial injection rates were only 2 to 4 l/s (1-2 bpm) but increased to 20 l/s (10 bpm) after the injection of several acid stages. More than 10,000 microseismic events were recorded, with a complex distribution. The stimulated zone extends to the northeast and east of the Paralana 2 well by up to 900m with depths between 3,500m and 4,000m.
Unlike the recent successful EGS projects in Nevada, Paralana 2 (in 2011) was drilled vertically and stimulated conventionally to achieve self-flow of 6 l/s and up to 20 l/s during injection. Using a horizontal well pair development concept similar to that pioneered in Nevada, there is potential to increase these rates significantly.

PARALANA HISTORICAL DRILLING ACTIVITY

Source: Geothermal Energy in Australia, Dr Cameron Huddlestone-Holmes, CSIRO, 2014.
Paralana Analogs from the US
| Name | Location | Installed Capacity | Annual Production |
| Mammoth | California, USA | 40 MW | 211 GWh |
| Tuscarora | Nevada, USA | 32 MW | 144 GWh |
| Heber | California, USA | 81.5 MW | 174 GWh |
| Desert Peak | Nevada, USA | 26 MW | 97.7 GWh |
| Blue Mountain | Nevada, USA | 63.9 MW | 233 GWh |
Source: US Energy Information Administration, US Federal Energy Regulatory Commission, United States Geological Survey via www.gridinfo.com
The above table identifies operating projects based in the USA which share similar power densities and temperatures. The majority of these projects have been in operation since the late 1980s and early 1990s; significant developments have since been made in geothermal reservoir modelling and engineering. None of these projects represent an Enhanced or Advanced Geothermal System or project.
The relationship between Installed Capacity and Annual Production for this group of projects highlights how the Installed Capacity (or the ‘Nameplate Capacity’) does not necessarily represent a consistent relationship to Annual Production across projects. Mammoth’s 40 MW capacity, for example, outproduces the Heber project’s annual production even though its installed capacity is almost twice that at 81.5 MW of capacity. Modern engineering and project characteristics can result in meaningful power production from lower installed capacities.
NEXT STEPS
- Modelling work to support a new generation EGS project at Paralana
- Refine Paralana’s power density modelling and likely energy production compared to US analogues utilising more modern engineering
- Assess the feasibility of further drilling at Paralana 2 in the context of further developing the project’s potential EGS development
- Assess potential joint venture opportunties
Subscribe to
announcements
